Debugging dump files created on another machine
Disclaimer - None of this article describes anything new or ground breaking, indeed Visual Studio 2010 has been out for quite some time. Developers don't usually spend their whole day debugging dumps until such time that there is a problem - thus this article serves as a quick refresher in times of need.
Visual Studio 2010 can open .Net4 process dump files to present you with a snapshot of the process in a familiar environment.
This is handy when machines running your application can't easily be debugged (eg a client or production machine)
Creating a dump file using Task Manager is easy (from Vista onwards) - simply right click the process and choose create dump.
However, If you want to take the .dmp file and analyse it on your own PC you need to ensure you have taken the correct dump. (assuming you want to do Managed Debugging in Visual Studio 2010, I'm not talking about WinDBG)
Consider the matrix below:
| OS architecture | |||
| 32 bit | 64 bit | ||
| Process running as | 32 bit | Task Manager | Use Debugging Tools (x86) to create 32 bit dump |
| 64 bit | N/A | Task Manager | |
Getting the correct dump
If you are running a 32bit OS and developing an app that targets x86 but deploying to a 64bit server then the yellow box is your scenario.
There is no standalone download page, you have to get it via the Windows SDK.
If you're in a panic/hurry the filename is dbg_x86.msi and a quick google turned up this direct link which worked as of 29th Aug 2010.
Once installed you navigate to C:\Program Files (x86)\Debugging Tools for Windows (x86) and execute
adplus.exe -hang -pn YourApp.exe -o c:\crashdump
Remeber to use -hang - Contrary to the name it wont hang your process :) Instead it will take a dump of the process and continue running which, if its a production machine, will generally keep the boss happy.
Opening the dump file
The easiest way is to first open your .sln for the program you are debugging then drag the .dmp file onto VS *or use File -> Open. Suppose your production code was compiled under C:\buildserver\myapp and you are running the solution from D:\development\myapp - VS is smart enough to find the source provided you opened the solution prior
You'll see something like:
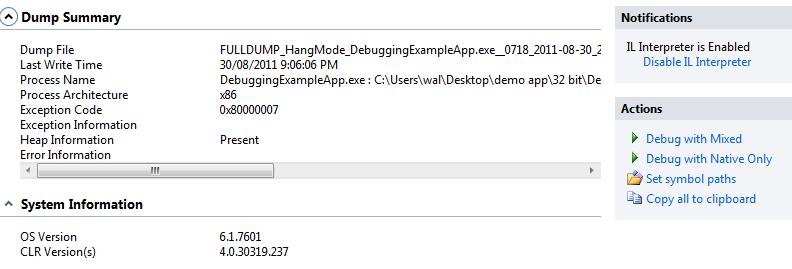
If 'Debug with Mixed' is greyed out then your process probably isn't a .Net4 one (check CLR Versions)
Debug with Mixed
Sometimes it just works, other times you get this:
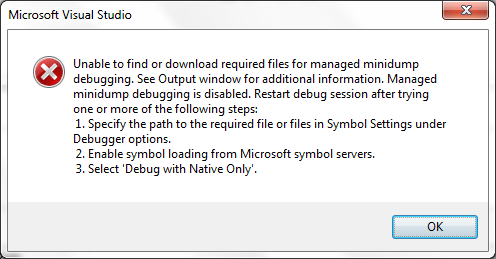
I'll paste the text of the error message so as to assist someone searching for this error message.
Unable to find or download required files for managed minidump debugging. See Output window for additional information. Managed minidump debugging is disabled. Restart debug session after trying one or more of the following steps
The output window had lots of stuff but this bit was interesting
Managed Minidump Debugging: The debugger was unable to find or download version 4.00.30319.237 of 'mscordbi.dll'.
Searching for this dll under C:\Windows\Microsoft.NET I find my version is indeed different, namely 4.00.30319.235. Running Windows Update fixed the issue by bringing the version up to date. I'm a little surprised the symbol server didn't sort this out because at the time of debugging 237 was the current version.
No Source Available
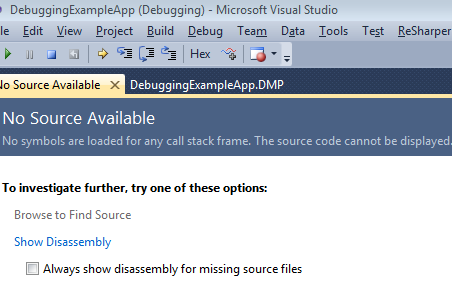
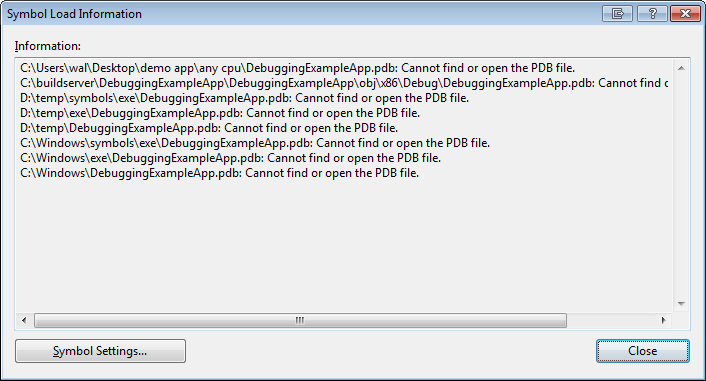
When you get this the first thing to check is the Modules Window (Ctrl-D,M) and examine the Symbol Load Information for the exe/dll in question.
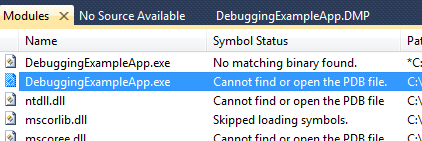
VS had a pretty good look for them as well:
Last revised: 23 Dec, 2011 03:41 AM History
No new comments are allowed on this post.
Comments
No comments yet. Be the first!